One of the advantages of R is that results are easy to visualize. For example, we can visualize how often a word is used through wordclouds. For that, we need to download and activate the wordcloud package.
# Load package.
library(wordcloud)
To make the wordcloud easily readable we reduce the information we want to display.
# It is easier to work with wordcloud if we tranform our file into a dataframe.
frequent_words <- as.data.frame(as.table(frequent_words))
colnames(frequent_words) <- c("word", "freq")
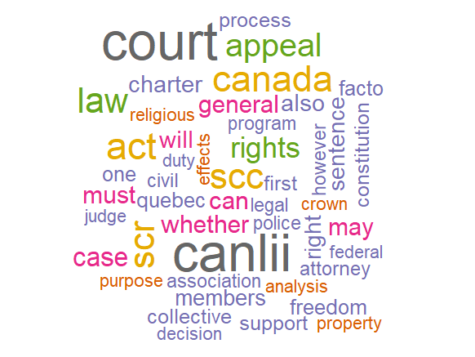
# In order not to overload the word cloud, we limit our analysis to the 50 most frequent words in the corpus.
most_frequent_words <- head(frequent_words,50)
Finally, we can proceed to the visualization.
# You can adjust the color to your liking.
wordcloud(most_frequent_words$word,most_frequent_words$freq, colors = brewer.pal(8, "Dark2"))
##
access_time Last update May 11, 2020.