We can next proceed to visiualizing this network in R.
A couple of packages in R deal with network analysis . The most popular of them is igraph.
library(igraph)
# The input is our 2-column matrix with the citation list.
citation_network <- graph_from_edgelist(as.matrix(all_citations), directed = TRUE)
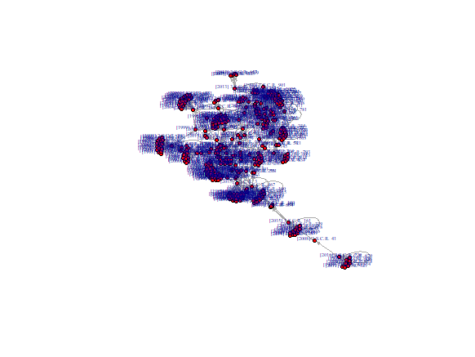
We can then use the plot() function to visualize the network.
plot(citation_network, layout=layout_with_fr, vertex.size=4,

vertex.label.dist=0.5, vertex.color="red", edge.arrow.size=0.2, vertex.label.cex=0.4)
##
While igraph is highly customizable, I personally prefer to work with self-standing network visualization tools. One of them is called “visone”. It can be downloaded free of charge online: http://visone.info.
access_time Last update September 3, 2019.