R is also great for data visualization. Here are a few simple graphs.
# Let's create the following dataset of numbers of claims per year:
year <- c(2008:2017)
claims <- c(32,45,67,98,112,77,67,98,103,88)
disputes <- data.frame(year, claims)
print(disputes)
##
| Year | Claim | |
|---|---|---|
| 1 | 2008 | 32 |
| 2 | 2009 | 45 |
| 3 | 2010 | 67 |
| 4 | 2011 | 98 |
| 5 | 2012 | 112 |
| 6 | 2013 | 77 |
| 7 | 2014 | 67 |
| 8 | 2015 | 98 |
| 9 | 2016 | 103 |
| 10 | 2017 | 88 |
# We can visualize that data using the plot() function.
plot(disputes)
##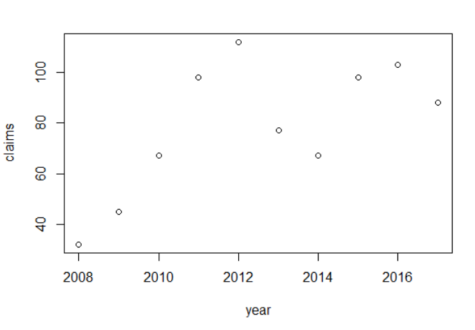
The plot() function, like other functions, in R has default settings.
# Consult the R documentation to learn how the function can be further customized.
?plot()
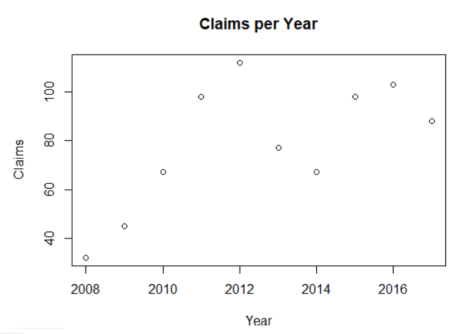
For example, it is possible to add axis and graph labels.
plot(disputes$year,disputes$claims, type = "p", xlab="Year", ylab="Claims",
     main = "Claims per Year")
##
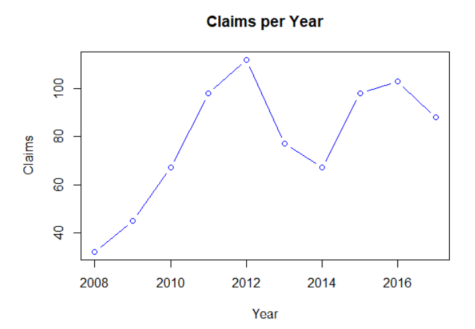
We can also plot data as both points and lines (“b”) and change the color of the graph.
plot(disputes$year,disputes$claims, type = "b", col="blue", xlab="Year", ylab="Claims",
     main = "Claims per Year")
##
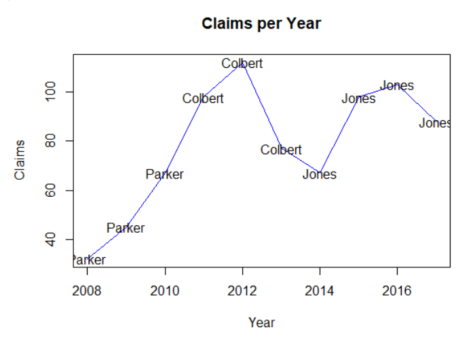
We can even plot text labels in R using the function text() in combination with plot(). For instance, here we imagine that there were 3 different judges over our timeframe, which in turn had an impact on the data.
judges <- c("Parker","Parker","Parker","Colbert","Colbert","Colbert","Jones","Jones","Jones","Jones")
# Let's add the judge data to our dataframe and print the data again.
disputes <- cbind(disputes, judges)
print(disputes)
##
| Year | Claim | Judges | |
|---|---|---|---|
| 1 | 2008 | 32 | Parker |
| 2 | 2009 | 45 | Parker |
| 3 | 2010 | 67 | Parker |
| 4 | 2011 | 98 | Colbert |
| 5 | 2012 | 112 | Colbert |
| 6 | 2013 | 77 | Colbert |
| 7 | 2014 | 67 | Jones |
| 8 | 2015 | 98 | Jones |
| 9 | 2016 | 103 | Jones |
| 10 | 2017 | 88 | Jones |
# We can add the name of the judges to the plot with the text() function.
plot(disputes$year,disputes$claims, type = "l", col="blue", xlab="Year", ylab="Claims",
     main = "Claims per Year")
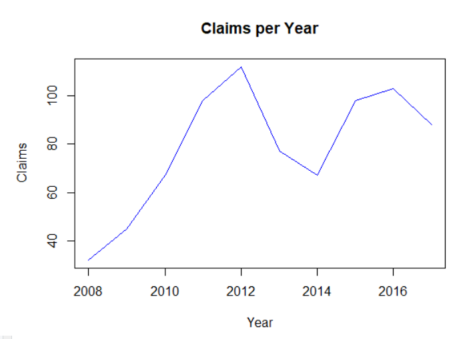
text(disputes$year,disputes$claims, label=disputes$judges)
access_time Last update May 8, 2020.